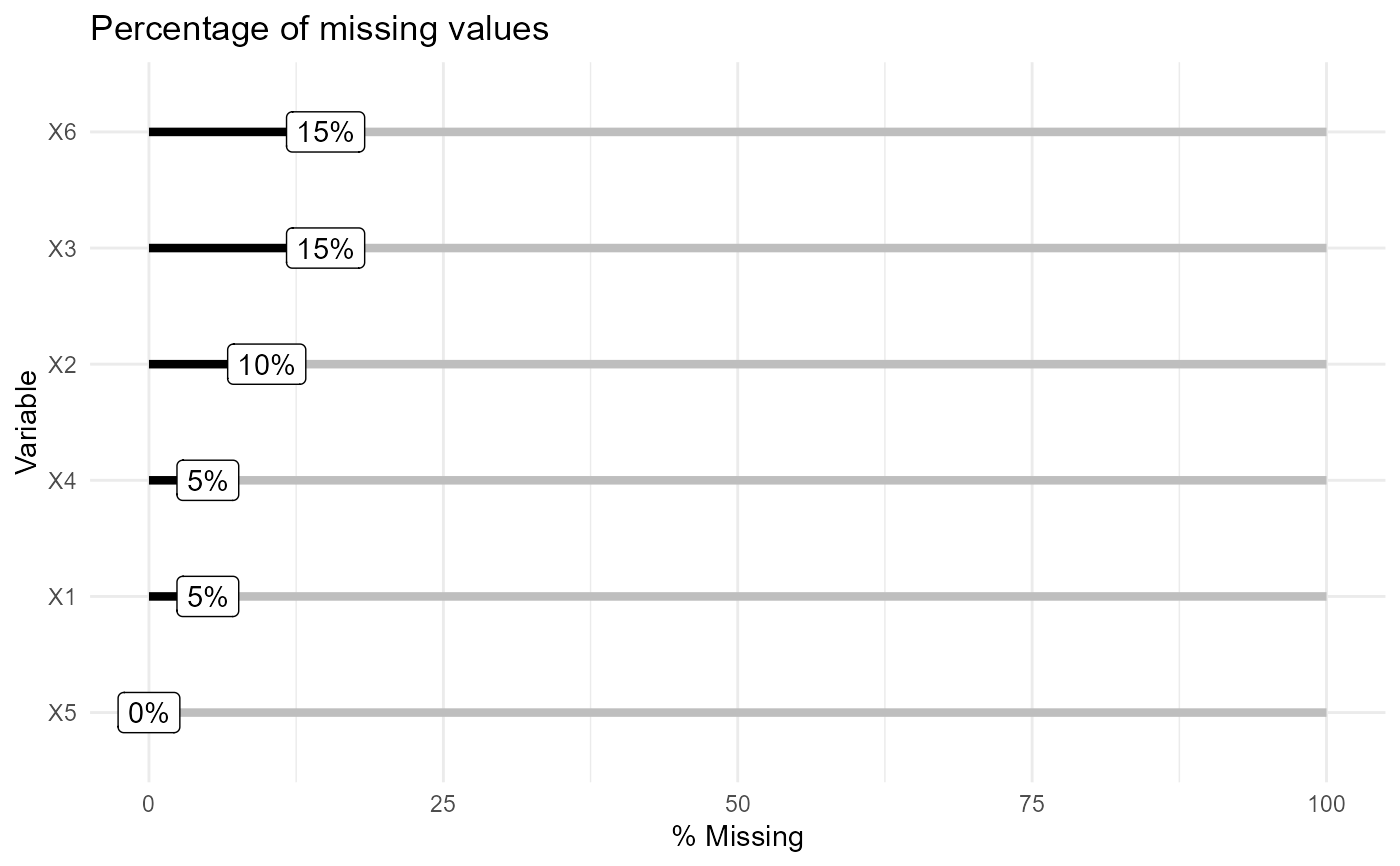
This function makes a plot showing percentage content of missing values per variable. When a variable has more than 20% missing values its color is red.
Examples
data(sim_miss)
plot_mv_segment(sim_miss)
This function makes a plot showing percentage content of missing values per variable. When a variable has more than 20% missing values its color is red.
data(sim_miss)
plot_mv_segment(sim_miss)