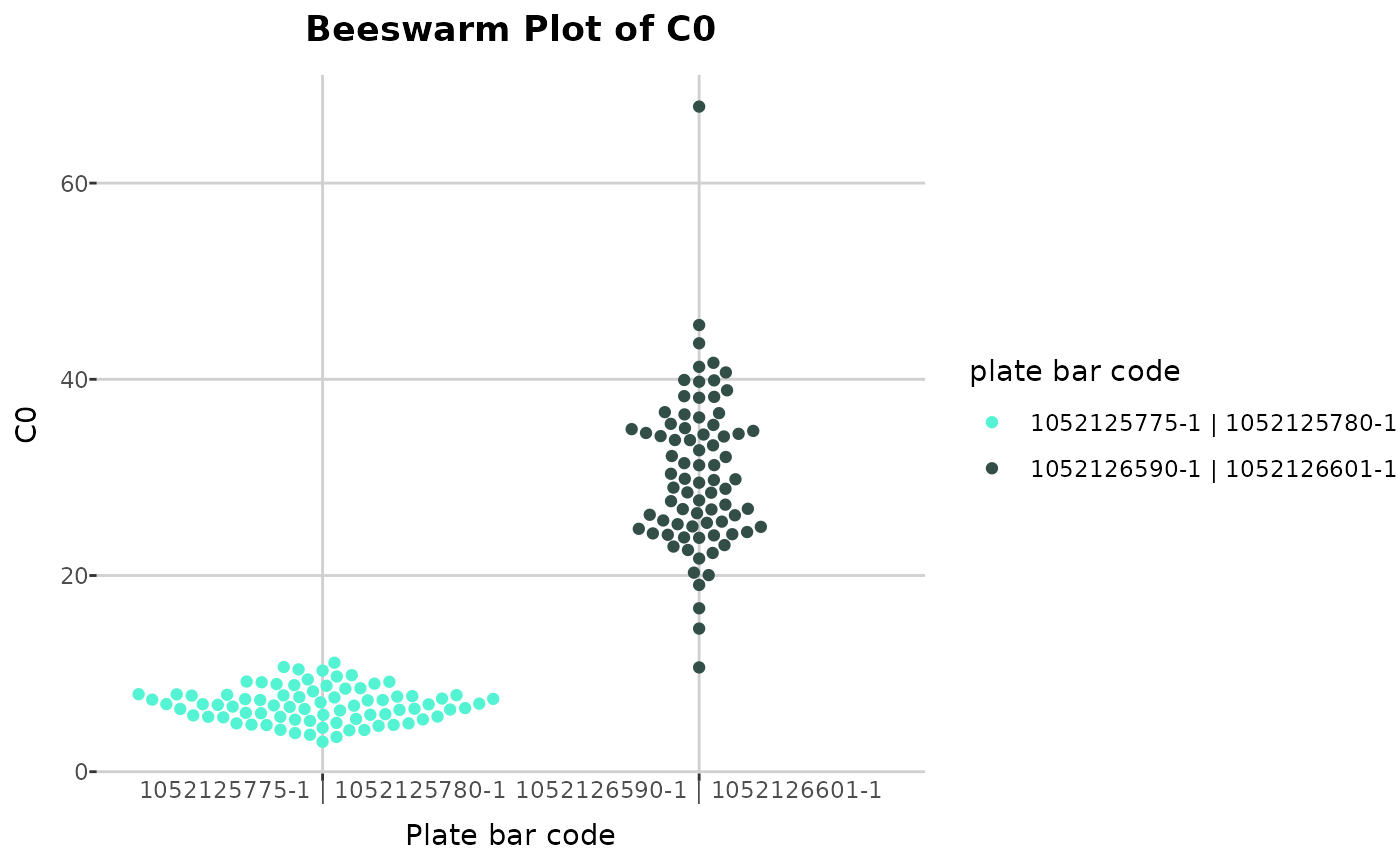
Beeswarm Plot of Metabolite Values
create_beeswarm_plot.RdThis function creates a beeswarm plot for a specified metabolite, allowing visualization of the distribution of metabolite values across different plate bar code.
Arguments
- dat
a
raw_dataobject. Output ofread_data()function.- metabolite
a character string specifying the name of the metabolite for which the beeswarm plot should be created.
Examples
path <- get_example_data("small_biocrates_example.xls")
path <- get_example_data("two_sets_example.xlsx")
dat <- read_data(path)
dat <- complete_data(dat, "limit", "limit", "limit")
#> Completing 16240 < LOD values...
#> No < LLOQ values found.
#> No > ULOQ values found.
create_beeswarm_plot(dat, "C0")