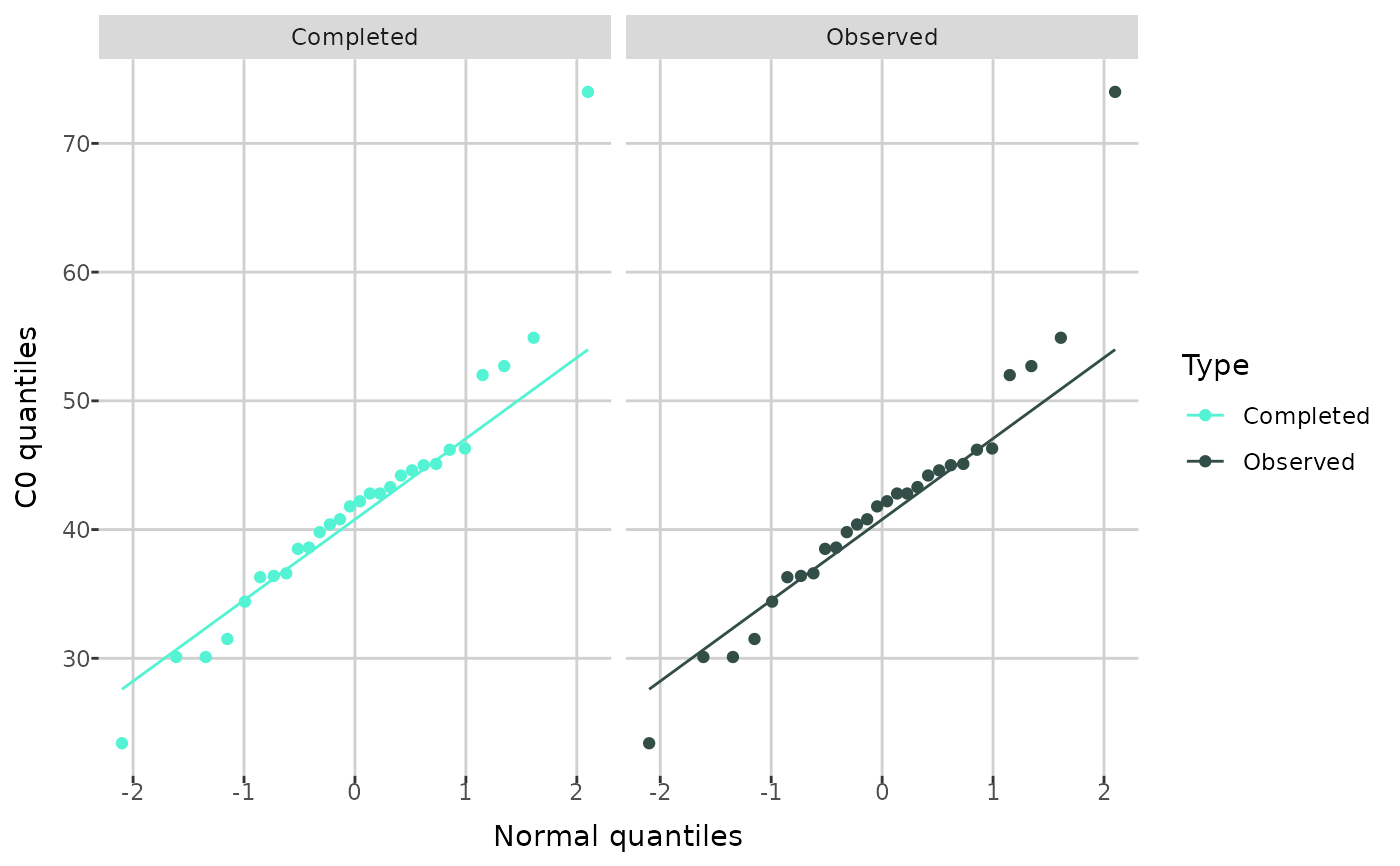
QQ plots of individual metabolite values before and after imputation
create_qqplot.Rdcreate_qqplot() returns QQ plots for the specified metabolite
before and after imputation.
Arguments
- dat
a
raw_dataobject, the output of theread_data()function. The data have to be completed, for example using thecomplete_data()function.- metabolite
a name of the metabolite of interest.
Examples
path <- get_example_data("small_biocrates_example.xls")
dat <- read_data(path)
dat <- complete_data(dat, "limit", "limit", "limit")
#> Completing 109 < LOD values...
#> Completing 6 < LLOQ values...
#> Completing 9 < ULOQ values...
create_qqplot(dat, "C0")