Venn diagram for group levels
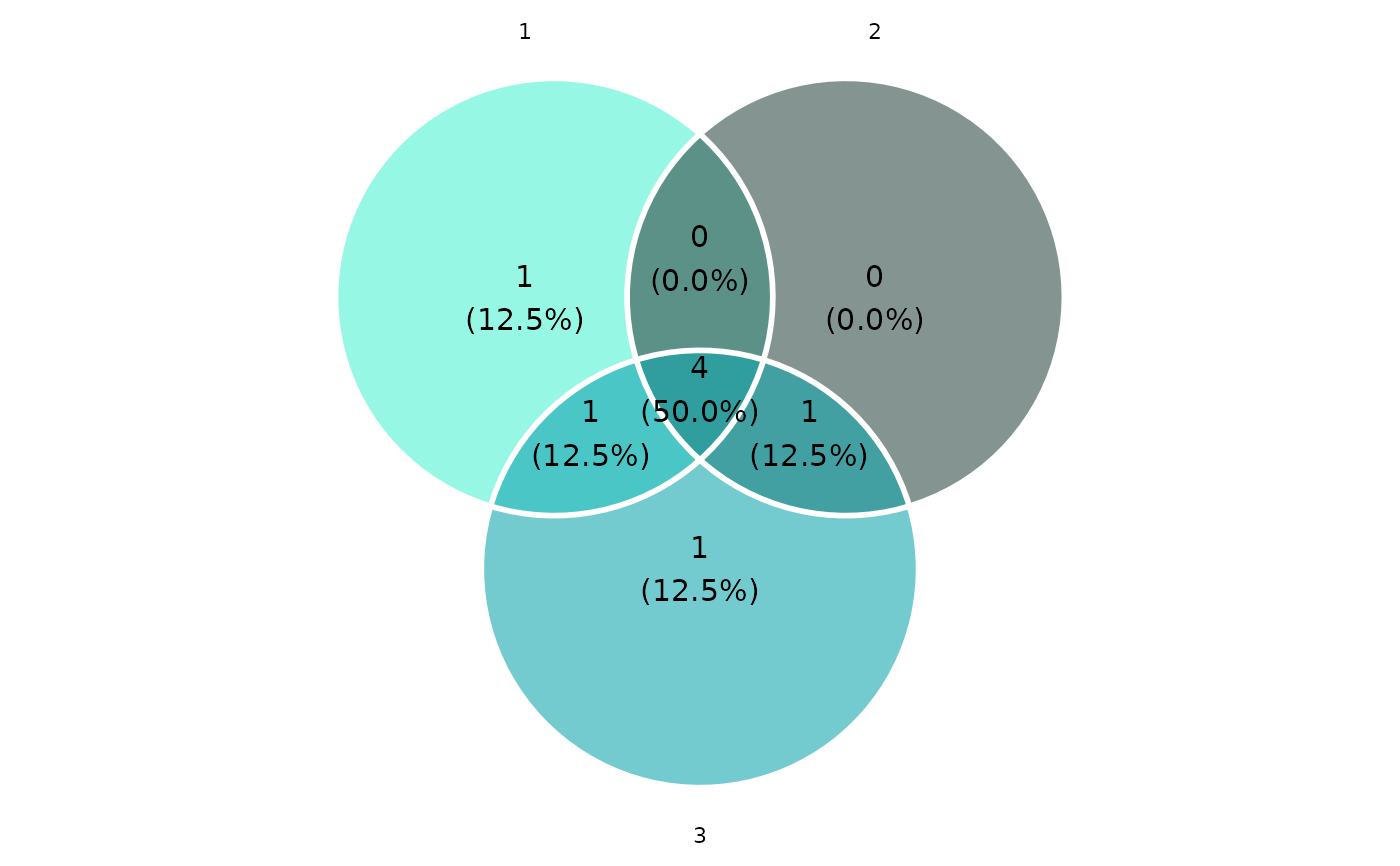
create_venn_diagram.RdThis function creates Venn diagram, showing counts of metabolites having ratios of missing values larger than the given threshold for each group level. Function works only when group has up to 4 levels.
Arguments
- dat
a
raw_dataobject, the output ofread_data(), with a group specified using theadd_group()function.- threshold
a minimum ratio of metabolite missing values in one group level for metabolite to be included in the diagram, given as decimal.
Examples
path <- get_example_data("small_biocrates_example.xls")
dat <- read_data(path)
dat <- add_group(dat, "group")
create_venn_diagram(dat, 0.1)
#> Warning: Although not display in plot, outside elements are still count in percentages.