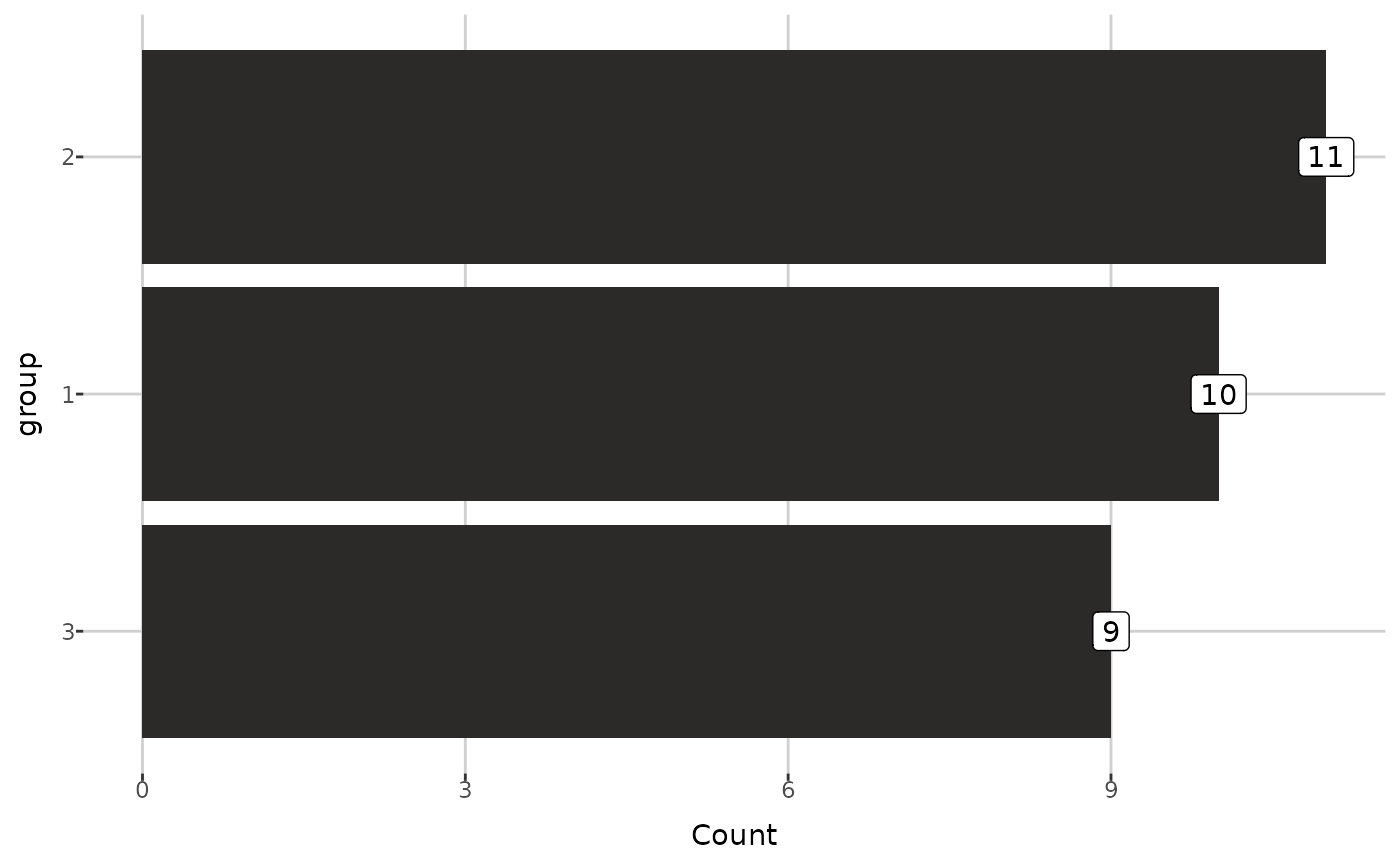
Barplot of group level sizes
plot_groups.Rdplot_groups() creates a barplot showing the count of observations in
each group level.
Arguments
- dat
a
raw_dataobject, the output ofread_data(), with a group specified using theadd_group()function.
Examples
path <- get_example_data("small_biocrates_example.xls")
dat <- read_data(path)
dat <- add_group(dat, "group")
plot_groups(dat)