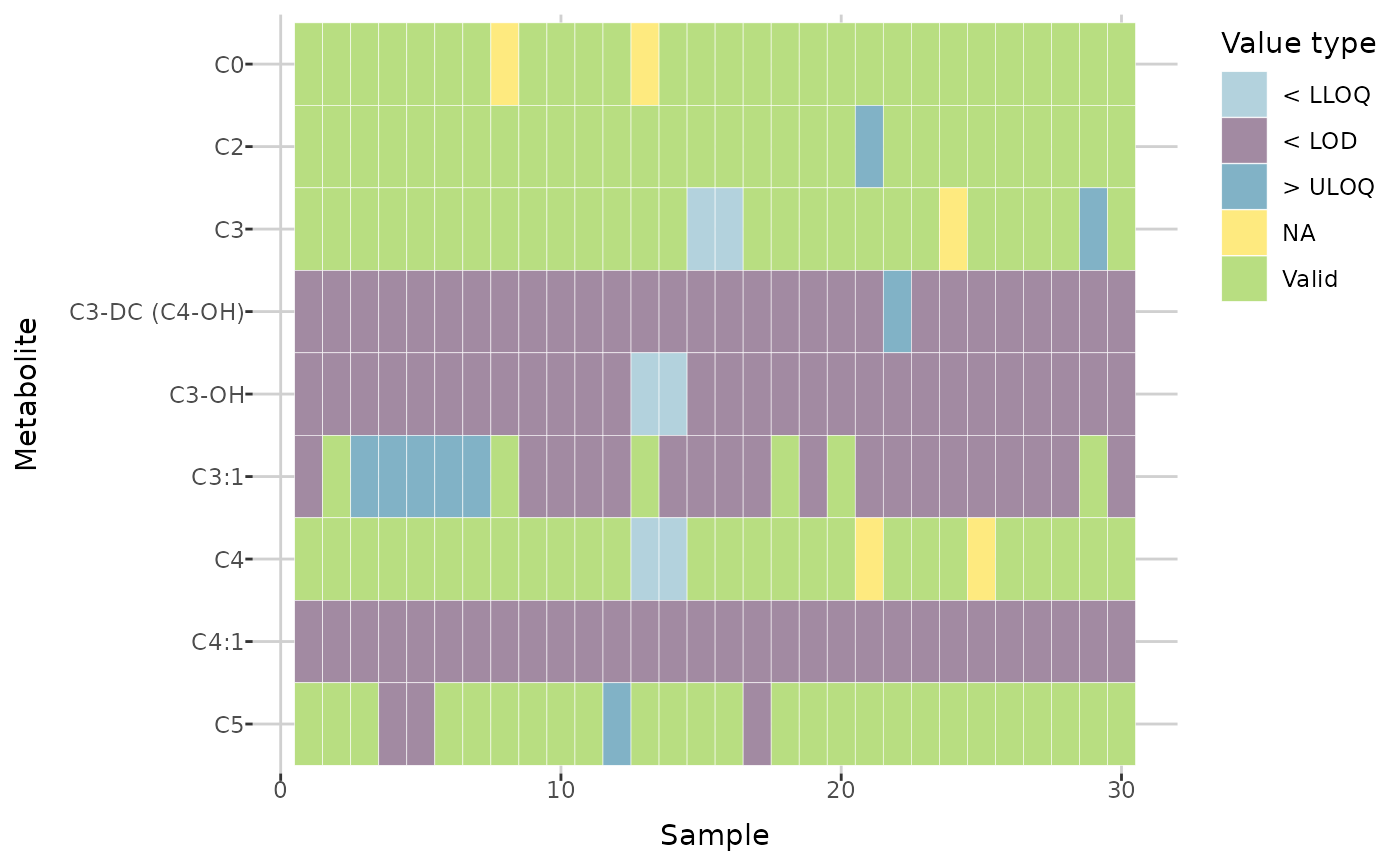
Heatmap of missing values
plot_heatmap.Rdplot_heatmap() creates a heatmap of missing values for the specified
plate bar code or for all of them.
Arguments
- dat
a
raw_dataobject. Output ofread_data()function.- plate_bar_code
a single plate bar code used to select observations to include in the plot. If
NULL(default), a grid of plots is returned, where each plot corresponds to a different plate bar code.- include_title
logical. Indicates whether the title with the plate bar code should be included (only if
plate_bar_codeis notNULL). Defaults toFALSE.- show_colors
logical. If
TRUE, distinct colors are applied to different types of missing values, following the conventions used in Biocrates® files.
Examples
path <- get_example_data("small_biocrates_example.xls")
dat <- read_data(path)
plot_heatmap(dat, "1036372116-1 | 1036372121-1")