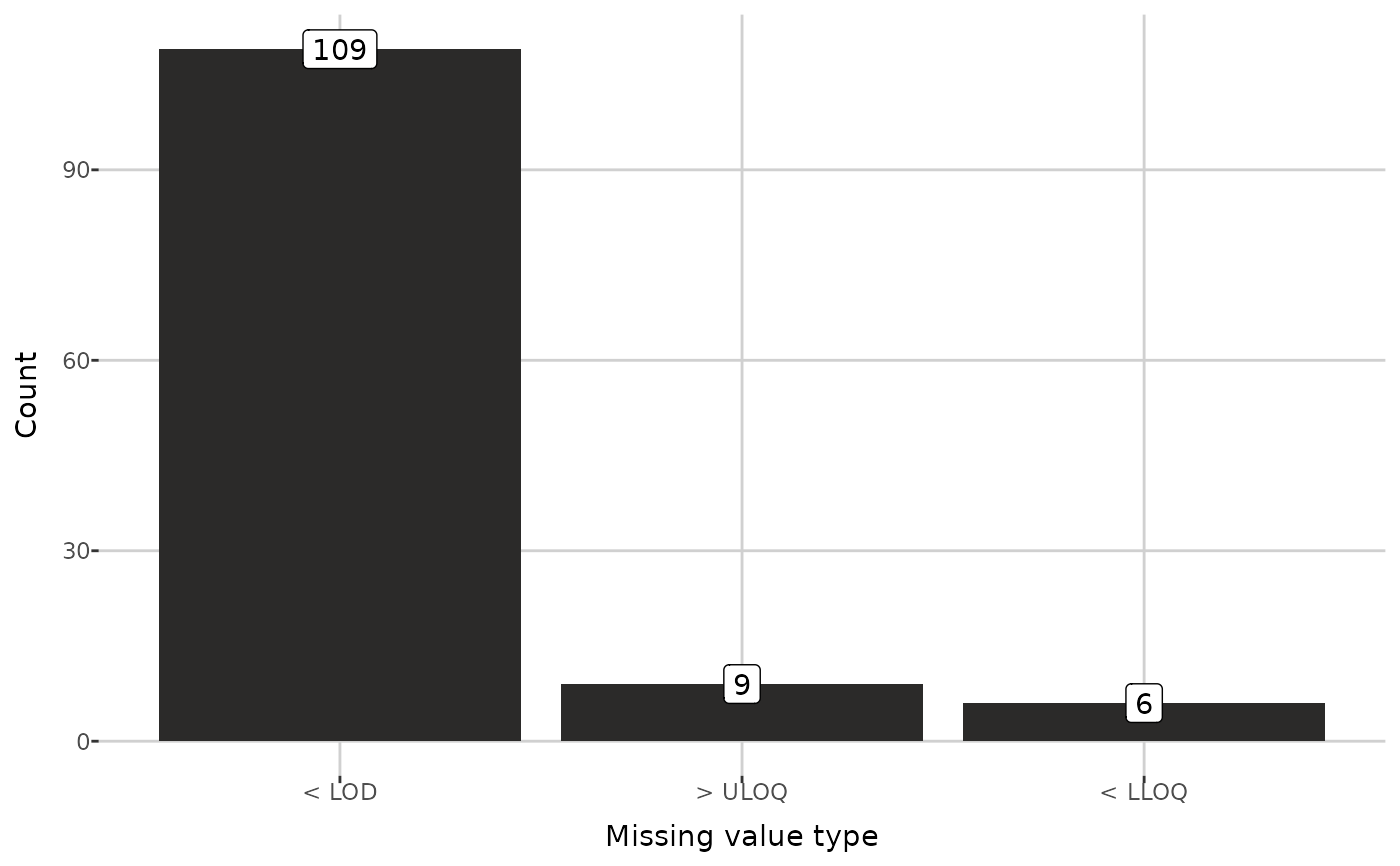
Barplot of missing values types
plot_mv_types.Rdplot_mv_types() creates a barplot showing the count of missing values for
each type.
Arguments
- dat
a
raw_dataobject. Output ofread_data()function.
Examples
path <- get_example_data("small_biocrates_example.xls")
test_dat <- read_data(path)
plot_mv_types(test_dat)