NanoString nCounter data analysis: challenges, workflows & best practices 🧬📊
NanoString, nCounter, gene expression, mRNA, miRNA, bioinformatics, normalization, differential expression
📌 Project highlights
- 🧬 Standardized nCounter data analysis workflow (5 key steps)
- ⚙️ Review of 11 R packages + nSolver software
- 📊 Covers QC, normalization, background correction, DE analysis
- ⚠️ Highlights sources of noise and bias
- 🚀 Practical recommendations for mRNA vs miRNA workflows
🔗 Explore the paper
🎉 New review out! This time we tackle something very practical:
👉 how to actually analyze NanoString nCounter data properly 😄
- 📚 Paper (open access): Challenges and opportunities in processing NanoString nCounter data
👉 A must-read if you’ve ever wondered “which pipeline should I even use?”
🎧 Audio summary
NanoString workflows, normalization strategies, and 11 different tools?
Yeah… that can escalate quickly 😄
👉 Here’s a short audio walkthrough 🎧 explaining what’s going on and what actually matters:
🔬 What is NanoString nCounter?
NanoString nCounter is a medium-throughput gene expression technology used for:
- mRNA analysis
- miRNA profiling
- clinical and low-quality samples
👉 Key advantage:
- ❌ no amplification step → less bias
- ✅ works well on low-quality samples :
It sits somewhere between:
- qPCR (high sensitivity)
- RNA-seq (high coverage)
⚙️ The core problem
Despite its advantages:
👉 there is no standard analysis pipeline
This leads to:
- inconsistent results
- difficult comparisons between studies
- confusion about best practices
🧠 What we did
We structured the entire workflow into 5 key steps:
🧪 1. Pre-processing
🔍 2. Quality control (QC)
🧊 3. Background correction
⚖️ 4. Normalization
📊 5. Differential expression
👉 This provides a common framework for comparing tools
📊 The workflow (big picture)
The diagram on page 5 clearly shows how tools map to workflow steps:
👉 Not a single tool covers everything
👉 nSolver covers most but still incomplete
➡️ Result: fragmented ecosystem
⚙️ Tools we analyzed
We reviewed 11 R packages, including:
- NanoTube
- NanoStringNorm
- NanoStringDiff
- NACHO
- nanoR
👉 Key observation:
- most tools cover only subset of the pipeline
- very few support full workflow integration
⚠️ Major sources of bias
nCounter data is affected by:
🔬 Technical variation
- batch effects
- probe-specific background
🧬 Biological variation
- sample differences
- RNA quality
⚖️ Normalization trade-offs
- removing bias may increase noise
👉 This is why preprocessing decisions matter so much
🧪 Key steps explained
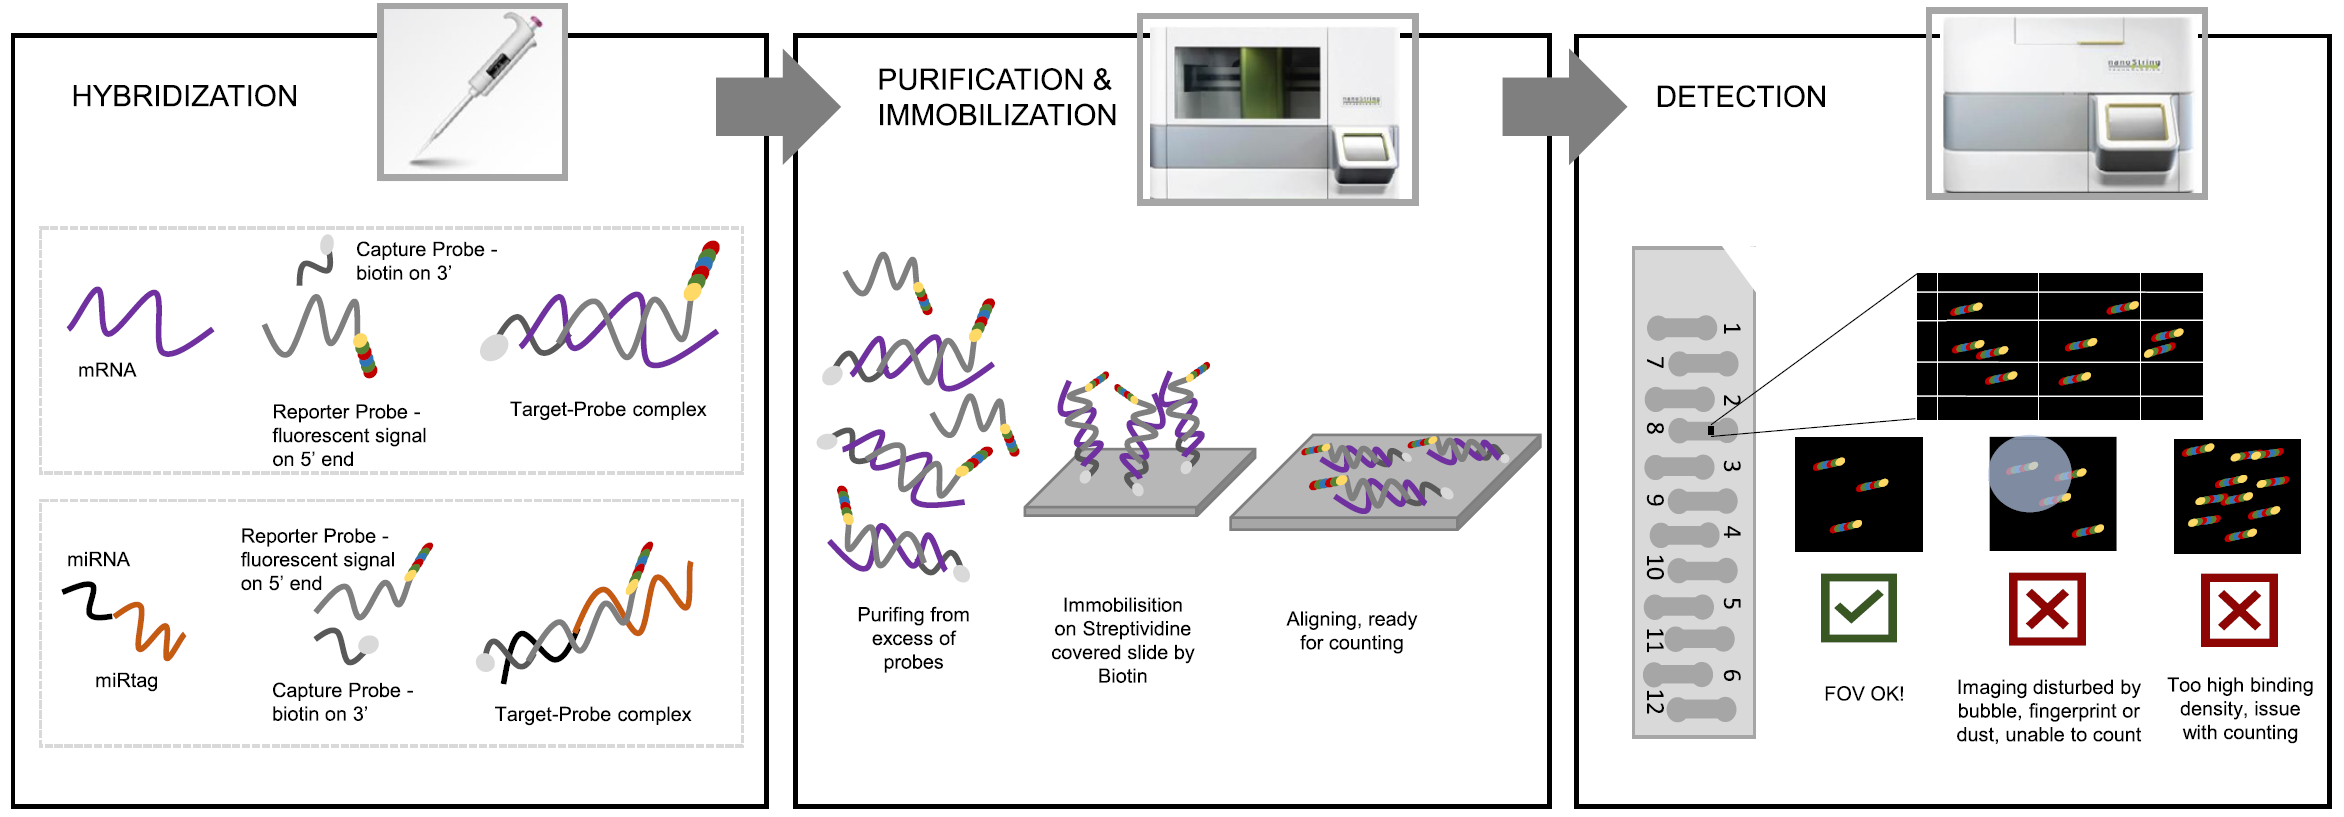
🔍 Quality control (QC)
Checks include:
- FOV (imaging quality)
- binding density
- positive/negative controls
- limit of detection
👉 ensures data is reliable before analysis
🧊 Background correction
Two main strategies:
- thresholding → keeps distribution
- subtraction → shifts distribution
👉 Each has trade-offs (especially for low-expression genes)
⚖️ Normalization
Critical step to remove technical variation:
- positive controls
- housekeeping genes
- spike-ins
👉 Different methods → different results
📊 Differential expression
Common approaches:
- t-test
- limma
- negative binomial models
- Bayesian methods
👉 choice depends on:
- data distribution
- experimental design
🧬 Key conclusions
- ⚠️ No single best pipeline
- ⚙️ Workflow must be carefully tailored
- 🧠 Data processing decisions strongly impact results
- 🔬 Tool choice depends on:
- mRNA vs miRNA
- experimental design
- available controls
- mRNA vs miRNA
👉 In short: analysis matters as much as the experiment itself
🚀 Practical recommendations
- 🧬 Use NanoTube for mRNA (robust + GUI)
- 🧠 Use nSolver for miRNA (ligation controls!)
- ⚙️ Always:
- perform QC first
- test normalization strategies
- validate results biologically
- perform QC first
👉 No shortcuts here 😄
💚 BioGenies perspective
This paper reinforces something we keep seeing:
👉 data processing = hidden source of variability
And more broadly:
- tools matter ⚙️
- pipelines matter 📊
- but understanding assumptions matters most 🧠